Posts Tagged 'tutorial'

Center element with unknown width

As with bootstrap progress bar post, this one is actually about CSS, not javascript, but I don’t want too many tags. So, the subject of today’s tutorial is centering stuff. In the good old days we could just place its left side at 50% and set left margin to minus half of content width. But what if we do not know content width in advance and therefore can’t set the margin a priori? That’s where newer CSS stuff helps:

transform: translate(-50%, -50%);

Yes, those are percents of its actual dimensions, whatever they will be. You can see it in action here.

Add more progress to bootstrap progress bar

Remember the last time when I posted useless and uninteresting javascript tutorial that gave this blog grand zero hits boost? It’s time to do that again :) Today we’ll be animating bootstrap progress bar to make it look like something is happening when in fact it is not. Just add this

@keyframes progress {
    from { background-position:  0px; }
    to   { background-position: 40px; }
}

.progress-bar-animated {
    animation: progress 1s linear infinite;
}

to your progress bar and decimate user frustration:

animated progress bar

Responsive font size with CKEditor

CKEditor is very nice WYSIWYG editor for web apps. It saves you many days of coding in exchange for just hours spent in DOM inspector trying to come up with CSS rules for it to play nice with your existing layout. But occasionally you will still need to write some code to work around their design choices. One of these cases is when you want to use responsive font size. Continue reading ‘Responsive font size with CKEditor’

First-person shooter using three.js

I am no longer working on COLT and currently contemplating what to do next. I have strong flash background, but this technology does not feel well. With WebGL technology exploding, on the other hand, I’ve decided to do old-school first-person shooter to see if this kind of work is something I want to do from now on, and get better idea of all the challenges involved.

Click to play

The result

The result is this sort of game where you pointlessly run around the platform and shoot monsters. Originally I thought I would complete it in 2-3 days, Ludum Dare style, but since I had no enough motivation to spend all my time on this, it took me whole month of random short coding sessions to “complete” it (and there are still some bugs to fix).

Another thing I hoped for was to write “how to make complete game with three.js” tutorial that all the internet would link to, as apparently there are no tutorials like that. It is easy to write “how to move the box” tutorial, but something more takes time that noone is really willing to spend. Well, the bad news are that I still can’t write the tutorial. I would need to make 10 more games like this before I can write one :) So the rest of this post is simply going to be adventure log, noting some tricks I used and some mistakes I made along the way.

Continue reading ‘First-person shooter using three.js’

3D bar chart on the globe using three.js

When people need to present per-country data such as GDP, they usually resort to color-coded maps or simple bar charts. In 3D, you could combine these two and end up with something like this:

globe bar chart
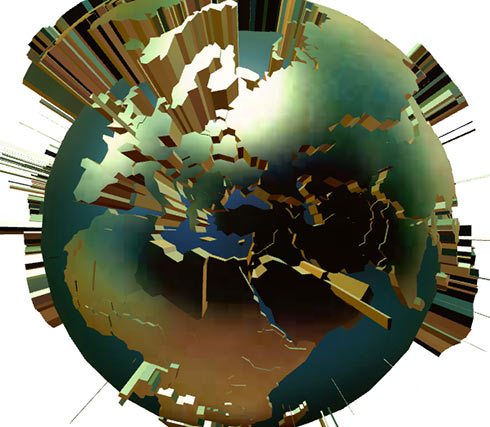
This is very obvious idea, yet I had no time to try it until last November. It worked, and I went on with my life, leaving the code to collect the dust. Then I saw Kaspersky cyberthreat map this March, which used extruded country shapes to support zooming. This reminded me this gold I was sitting on, and now I was finally able to fork out some time to undust it and push to github.

Overview

Basically, you take 2D country shapes and tessellate it on the sphere surface, then extrude towards the sphere center. You end up with cone-shaped meshes that you can then scale to build this kind of geo- bar chart. The catch is that corresponding three.js scene weighs much more than its 2D source data (ObjectExporter blows 100 KB of GeoJSON up to many MBs). Much of this extra weight comes in the form of useless digits in vertex data, but even with that removed there is extra dimension, data duplication and so on. To work around this issue you have to build 3D geometry from tessellated 2D data on the fly – this puts 3D data size at ~150% of 2D. Still sucks, if compared to TopoJSON, but tolerable. Corresponding code looks like

for (var name in data) {
    geometry = new Map3DGeometry (data[name], innerRadius);
    globe.add (data[name].mesh = new THREE.Mesh (geometry, material));
}

Map3DGeometry class and the tool to create the data are now at github.

Tessellation

Following documents the problems you would encounter if you did it yourself, so you may probably skip it. Continue reading ‘3D bar chart on the globe using three.js’


Old stuff

May 2024
M T W T F S S
 12345
6789101112
13141516171819
20212223242526
2728293031